
Surface roughness is a crucial aspect of manufacturing and engineering, affecting the functionality and aesthetics of a wide range of products. It plays a pivotal role in determining the quality and performance of mechanical components, from precision bearings to automotive parts. Surface roughness symbols, grade numbers, indication, terminology, and calculation methods are indispensable tools in the world of engineering and manufacturing, helping professionals ensure that the surfaces they work with meet the required standards. In this comprehensive article, we will delve deep into the subject of surface roughness, providing a thorough understanding of its various facets.
What Is Surface Roughness
Surface roughness is defined as the variations in the height of a surface relative to a reference plane. These variations can be microscopic or macroscopic and are typically caused by various manufacturing processes, environmental factors, or wear and tear over time. Surface roughness can affect the functionality, appearance, and longevity of products. Therefore, it is essential to measure and control surface roughness to ensure that manufactured components meet the desired specifications and performance requirements.
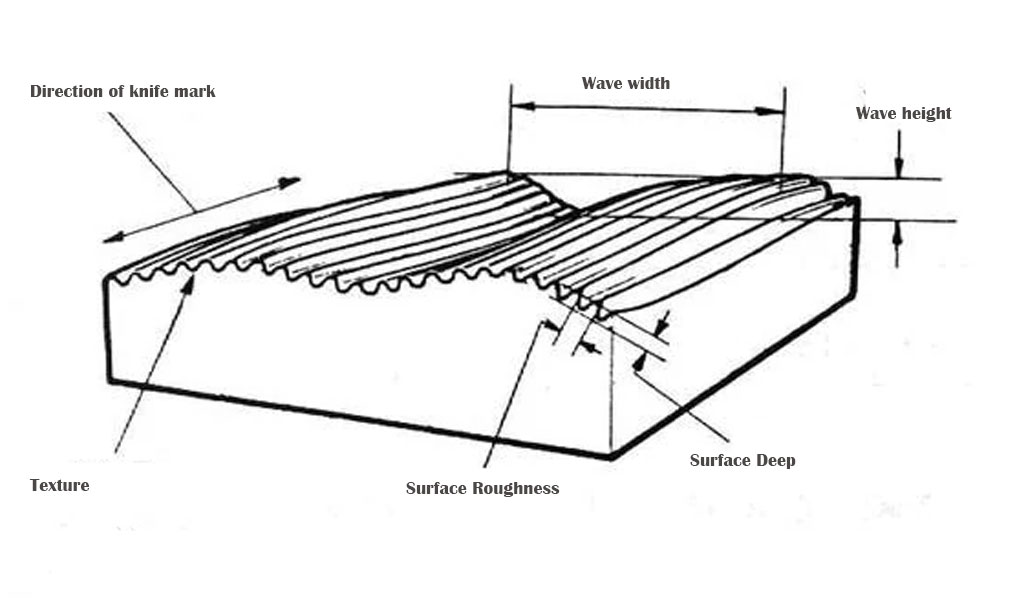
Surface roughness refers to the unevenness of the machined surface with small spacing and tiny peaks and valleys. The distance (wave pitch) between the two wave crests or two wave troughs is very small (less than 1mm), which is a microscopic geometric shape error. The smaller the surface roughness, the smoother the surface.
Surface roughness is generally caused by the machining method used and other factors, such as the friction between the tool and the part surface during the machining process, the plastic deformation of the surface metal during chip separation, and high-frequency vibration in the process system. Due to different cnc machining methods and workpiece materials, the depth, density, shape and texture of the marks left on the processed surface are different.
| Finish level (old standard) | Roughness Ra (μm) | 1) Surface Condition, 2) Machining Method and 3) Application Examples |
| ▽1 | 400~800 | |
| ▽2 | 200~400 | 1) Obvious tool marks 2) Rough turning, boring, planing, drilling 3) Surface after rough machining, 2 Welds before welding, rough drilling walls, etc. |
| ▽ 3 | 100~200 | 1) Visible tool marks 2) Rough turning, planing, milling, drilling 3) General non-joining surfaces, such as shaft end faces, chamfers, sides of gears and pulleys, non-working surfaces of keyways, and weight-reducing hole surfaces |
| ▽4 | 50~100 | 1) Visible machining marks 2) Turning, boring, planing, drilling, milling, filing, grinding, rough reaming, tooth milling 3) The mating surfaces of unimportant parts, such as pillars, brackets, shells, bushings, shafts, covers, etc. End face. The free surface of the fastener, the surface of the fastener through hole, the non-centering surface of the internal and external splines, the circular surface of the gear top ring that is not used as a measurement reference, etc. |
| ▽5 | 25~50 | 1) Micro processing marks 2) Turning, boring, planing, milling, scraping 1 to 2 points/cm^2, pulling, grinding, filing, rolling, milling 3) Connection with other parts does not form a matching surface, such as The end faces of boxes, shells, end covers and other parts. Fixed bearing surfaces that require centering and mating properties such as centering shafts, working surfaces of keys and keyways. The surface of the fastening thread is not important. Surfaces requiring knurling or oxidation |
| ▽6 | 12.5~25 | 1) Processing traces cannot be seen clearly 2) Turning, boring, planing, milling, reaming, pulling, grinding, rolling, scraping 1 to 2 points/cm^2 milling teeth 3) Housing hole for installing G-class bearings with a diameter exceeding 80mm , the tooth surface of ordinary precision gears, the positioning pin hole, the surface of the V-shaped pulley, the outer diameter of the internal spline with outer diameter centering, the centering shoulder surface of the bearing cap |
| ▽7 | 6.3~12.5 | 1) The direction of visible processing marks 2) Turning, boring, drawing, grinding, end milling, scraping 3 to 10 points/cm^2, rolling 3) Surfaces that require centering and matching properties, such as taper pins and cylinders The surface of the pin, the shaft diameter and housing hole matched with G-class precision rolling bearings, the shaft diameter for medium-speed rotation, the shaft diameter and housing hole matched with E and D-class rolling bearings with a diameter exceeding 80mm, the centering of internal and external splines Inner diameter, external spline key side and centering outer diameter, interference fit IT7 grade hole (H7), clearance fit IT8~IT9 grade hole (H8, H9), ground gear surface, etc. |
| ▽8 | 3.2~6.3 | 1) Microdiscrimination of the direction of processing marks 2) Reaming, grinding, boring, drawing, scraping 3 to 10 points/cm^2, rolling 3) The mating surface that requires stable mating properties for a long time, IT7 grade shaft and hole mating surface , Gear surfaces with high precision, important parts subject to variable stress, shaft diameter surfaces mated with E and D grade bearings with diameters less than 80mm, shaft surfaces in contact with rubber seals, IT13 ~ IT16 grades with sizes greater than 120mm Measuring surfaces of gauges for holes and shafts |
| ▽9 | 1.6~3.2 | 1) The direction of the processing marks cannot be discerned 2) Cloth wheel grinding, grinding, grinding, super processing 3) The surface of important parts that are subject to variable stress during work. Ensure the fatigue strength, anti-corrosion and durability of the parts, and do not damage the mating surfaces during operation, such as shaft diameter surfaces, surfaces requiring airtightness and supporting surfaces, cone centering surfaces, etc. IT5 and IT6 grade mating surfaces, high-precision gear surfaces, shaft diameter surfaces mated with G-grade rolling bearings, IT7~IT9 grade holes with sizes greater than 315mm and IT10~IT12 grade holes with gauge grade sizes greater than 120~315mm for shafts and Measuring surface of shaft gauge, etc. |
| ▽10 | 0.8~1.6 | 1) Dark glossy surface 2) Super processing 3) The surface of important parts that are subject to large variable stress during work. Guarantees a precisely centered cone surface. Hole surface for hydraulic transmission. The inner surface of the cylinder liner, the outer surface of the piston pin, the instrument guide surface, and the working surface of the valve. IT10~IT12 grade holes and shaft gauge measuring surfaces with sizes less than 120mm, etc. |
| ▽11 | 0.4~0.8 | |
| ▽12 | 0.2~0.4 | |
| ▽13 | 0.1~0.2 | |
| ▽14 |
Surface roughness is closely related to the matching properties, wear resistance, fatigue strength, contact stiffness, vibration and noise of mechanical parts, and has an important impact on the service life and reliability of mechanical products. Generally, Ra is used for labeling.
To achieve this, engineers and manufacturers use a standardized system that includes surface roughness symbols, grade numbers, indication, terminology, and calculation methods. This system provides a common language for describing and quantifying surface roughness, making it easier to communicate requirements and specifications within the industry.
Surface Roughness Symbols
Surface roughness symbols are graphical representations used to communicate the desired surface finish of a component. These symbols are an integral part of engineering drawings and blueprints and help ensure that all parties involved in the manufacturing process have a clear understanding of the required surface finish.
ISO Surface Roughness Symbols
ISO surface roughness symbols are a standardized system for specifying and communicating the desired surface finish of a component on engineering drawings and technical documents. These symbols are defined by the International Organization for Standardization (ISO) in the ISO 1302:1999 standard, titled “Geometrical Product Specifications (GPS) – Indication of surface texture in technical product documentation.” ISO surface roughness symbols play a vital role in ensuring that manufacturers and quality control personnel have a clear understanding of surface finish requirements. Let’s explore some of the key ISO surface roughness symbols:
Ra (Arithmetic Mean Deviation of the Profile): Ra is one of the most commonly used surface roughness symbols. It represents the average value of the absolute distances from the profile to the mean line within a specified sampling length. Ra is expressed in micrometers (µm) or microinches (µin), depending on the unit system used.
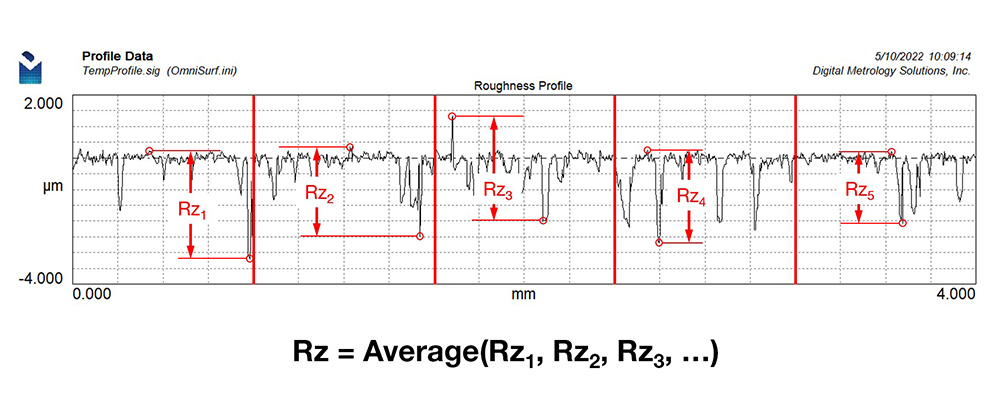
Rz (Average Maximum Height): Rz represents the average difference between the highest peak and lowest valley within a specified sampling length. It provides information about the maximum roughness peaks and valleys on the surface. Rz is also expressed in micrometers (µm) or microinches (µin).
Rt (Total Height of the Profile): Rt symbolizes the total height difference between the highest peak and lowest valley within a specified sampling length. Unlike Ra, which considers the average deviation, Rt accounts for the full range of surface variations. Rt is expressed in micrometers (µm) or microinches (µin).

Wt (Waviness Total Height): Wt represents the total height difference between the highest peak and lowest valley of the waviness pattern within a specified sampling length. It helps distinguish the larger-scale irregularities on the surface. Wt is also expressed in micrometers (µm) or microinches (µin).
Wz (Waviness Maximum Height): Wz represents the maximum height difference between the highest peak and lowest valley within a specified sampling length for the waviness pattern. It provides information about the largest waviness irregularities. Wz is expressed in micrometers (µm) or microinches (µin).
L (Longitudinal Lay): The “L” symbol indicates that the predominant surface texture features run parallel to the direction of the symbol. It describes the orientation of the surface texture.
V (Transverse Lay): The “V” symbol indicates that the predominant surface texture features run perpendicular to the direction of the symbol. This symbolizes a transverse orientation of the surface texture.
X (Isotropic Lay): The “X” symbol suggests that the surface texture features have no predominant direction. It indicates that the surface is isotropic and has no specific orientation.
ISO 1302:1999 Standard
One widely recognized standard for surface roughness symbols is ISO 1302:1999, titled “Geometrical Product Specifications (GPS) – Indication of surface texture in technical product documentation.” ISO 1302 defines a set of symbols that represent different aspects of surface roughness. These symbols include:
Profile Symbols: Profile symbols indicate the method used to measure surface roughness and include symbols like Ra, Rz, and Rt.
Ra (Arithmetic Mean Deviation of the Profile): This symbol represents the average value of the absolute distances from the profile to the mean line within a sampling length.
Rz (Average Maximum Height): Rz represents the average difference between the highest peak and lowest valley within a sampling length.
Rt (Total Height of the Profile): Rt symbolizes the total height difference between the highest peak and lowest valley within a sampling length.
Waviness Symbols: Waviness symbols indicate the larger-scale irregularities on a surface. Examples include Wt and Wz.
Wt (Waviness Total Height): This symbol represents the total height difference between the highest peak and lowest valley of the waviness pattern within a sampling length.
Wz (Waviness Maximum Height): Wz represents the maximum height difference between the highest peak and lowest valley within a sampling length for the waviness pattern.
Lay Symbols: Lay symbols describe the predominant direction of the surface texture, indicating whether it is longitudinal, transverse, or isotropic. Examples include L, V, and X.
L (Longitudinal Lay): The L symbol signifies that the predominant surface texture features run parallel to the direction of the symbol.
V (Transverse Lay): The V symbol indicates that the predominant surface texture features run perpendicular to the direction of the symbol.
X (Isotropic Lay): The X symbol suggests that the surface texture features have no predominant direction.
Additional Symbols: ISO 1302 also includes symbols for indicating special requirements, such as those related to machining allowances and surface treatment processes.
These symbols are typically displayed on engineering drawings and are accompanied by numerical values that specify the desired roughness parameters. For example, Ra 0.8 indicates an arithmetic mean deviation of 0.8 micrometers.
ASME Y14.36M-1996 Standard
In addition to ISO standards, the American Society of Mechanical Engineers (ASME) has its own standard for surface roughness symbols, known as ASME Y14.36M-1996, “Surface Texture Symbols.” This standard provides a comprehensive set of symbols and guidelines for indicating surface texture on engineering drawings. ASME symbols are often used in the United States and North America.
While ISO and ASME standards differ in some aspects, both serve the same fundamental purpose: to convey information about surface roughness in a clear and standardized manner.
Grade Numbers
Grade numbers, also known as roughness grade numbers or roughness values, are numerical representations of surface roughness. They provide a quantitative measure of the surface finish and are typically associated with specific surface roughness symbols.
Ra (Arithmetic Mean Deviation of the Profile)
The Ra value represents the arithmetic mean deviation of the profile and is one of the most commonly used roughness parameters. It quantifies the average roughness of a surface over a specified measuring length. The Ra value is expressed in micrometers (µm) or microinches (µin), depending on the unit system used.
The Ra value is calculated by finding the average of the absolute distances between the peaks and valleys of the surface profile within the measuring length. It provides information about the overall texture of the surface, with lower Ra values indicating smoother surfaces and higher values indicating rougher surfaces.
Rz (Average Maximum Height)
Rz, or the average maximum height, measures the average difference between the highest peak and lowest valley within a specified sampling length. Unlike Ra, which considers all deviations from the mean line, Rz focuses on the larger deviations, making it a useful parameter for assessing the impact of significant surface irregularities on functional performance.
Rz values are typically expressed in micrometers (µm) or microinches (µin). A lower Rz value indicates a surface with smaller amplitude irregularities, while a higher Rz value suggests larger and more pronounced irregularities.
Rt (Total Height of the Profile)
The Rt value, or total height of the profile, represents the total height difference between the highest peak and lowest valley within a specified sampling length. It provides a measure of the overall surface roughness, considering all deviations from the mean line, regardless of their direction.
Rt values are expressed in micrometers (µm) or microinches (µin). This parameter is useful when it is essential to understand the complete range of surface variations, including both peaks and valleys.
Indication of Surface Roughness
Surface roughness indication is the process of specifying the desired surface finish on engineering drawings and other technical documents. Proper indication ensures that manufacturers and quality control personnel understand the surface finish requirements and can achieve the desired results.
Surface Roughness Callouts
Surface roughness is typically indicated on engineering drawings using a combination of symbols, grade numbers, and additional information. The callout might look like this:
Surface Finish: Ra 0.4µm (16µin)In this example, “Ra” represents the chosen roughness symbol, and “0.4µm (16µin)” is the specified grade number, indicating the desired surface finish. The unit of measurement used (micrometers or microinches) should be clearly stated, and any additional requirements, such as the direction of lay or special treatment processes, should also be included in the callout.
Importance of Accurate Indication
Accurate indication of surface roughness is crucial because it directly affects the manufacturing process. If the surface finish is not properly specified, manufacturers may produce components with inadequate surface quality, leading to performance issues, increased wear and tear, and potential safety concerns.
Conversely, over-specifying surface roughness requirements can lead to unnecessary costs and production challenges. Therefore, it is essential to strike a balance between the functional requirements of the component and the achievable surface finish.
Surface Roughness Terminology
Understanding surface roughness requires familiarity with a specific set of terminology commonly used in the field of metrology (the science of measurement). Here are some key terms used in surface roughness analysis:
1. Profile
The profile is a graphical representation of the surface texture along a specific cross-section of a component. It shows the variations in height from the mean line and provides insights into the surface’s roughness and waviness.
2. Amplitude
Amplitude refers to the height difference between a peak and a valley on the surface. Larger amplitudes indicate more significant irregularities in the surface texture.
3. Wavelength
Wavelength represents the distance between consecutive peaks (or valleys) on the surface. Shorter wavelengths indicate fine surface texture, while longer wavelengths indicate coarser texture.
4. Sampling Length
The sampling length is the distance over which surface roughness measurements are taken. It is a critical parameter in surface roughness analysis, as different sampling lengths can yield different results.
5. Filter
Filters are used in surface roughness measurement to isolate specific components of the surface texture. Common filters include Gaussian and cutoff filters, which help analyze different aspects of roughness, such as waviness and form error.
6. Skewness and Kurtosis
Skewness and kurtosis are statistical parameters used to describe the asymmetry and peakedness of the surface roughness profile, respectively. They provide insights into the shape of the profile and can be useful for diagnosing surface quality issues.
7. Lay
Lay refers to the predominant direction of the surface texture, whether it runs longitudinally, transversely, or is isotropic. Understanding the lay is important for interpreting surface finish requirements accurately.
8. Isotropy
Isotropy indicates that the surface texture has no predominant direction and is equally rough in all directions. It is denoted by the symbol “X.”
9. Anisotropy
Anisotropy suggests that the surface texture exhibits variations in roughness in different directions. Understanding anisotropy is crucial for components subjected to directional stresses.
Surface Roughness Calculation
Surface roughness is quantified using various roughness parameters, such as Ra, Rz, and Rt, as discussed earlier. These parameters are calculated from the surface profile data obtained through specialized instruments like profilometers or surface roughness testers. Here’s an overview of how these parameters are calculated:
1. Data Collection
The first step in surface roughness calculation is data collection. This involves measuring the surface profile using a suitable instrument. The instrument typically moves a stylus or probe along the surface, recording height deviations at regular intervals.
2. Filtering
Before calculating roughness parameters, it is common to apply a filter to the raw profile data. Filtering helps isolate the specific roughness components of interest, such as waviness or form error. Gaussian filters are commonly used for this purpose.
3. Profile Evaluation
Once the data is filtered, the profile is evaluated to determine the roughness parameters. For Ra, the arithmetic mean deviation, the absolute values of the deviations from the mean line are averaged over the sampling length. For Rz, the average maximum height, the highest peak and lowest valley within the sampling length are determined and averaged.
4. Reporting
The calculated roughness parameters are reported along with the appropriate surface roughness symbol and unit of measurement (e.g., Ra 0.8µm). This information is included in engineering drawings and technical documents to communicate the surface finish requirements to manufacturers and quality control personnel.
5. Surface Texture Analysis
In addition to the basic roughness parameters, advanced surface texture analysis may involve assessing parameters like skewness and kurtosis to gain a more comprehensive understanding of the surface’s characteristics.
Factors Influencing Surface Roughness
Achieving the desired surface roughness is not always straightforward, as several factors can influence the final result. Manufacturers must consider these factors to produce components that meet the specified surface finish requirements. Some key factors include:
1. Machining Process
The choice of machining process, such as turning, milling, grinding, or honing, significantly affects surface roughness. Each process has its own inherent characteristics that impact the final surface texture.
2. Cutting Tools
The type of cutting tool, its sharpness, and the tool’s wear rate play a crucial role in determining surface finish. Worn or improperly maintained tools can lead to poor surface quality.
3. Cutting Speed and Feed Rate
The cutting speed (surface speed of the workpiece relative to the tool) and feed rate (the rate at which material is removed) must be carefully controlled to achieve the desired surface finish.
4. Material Properties
The material being machined can influence surface roughness. Harder materials tend to produce rougher surfaces, while softer materials may result in smoother finishes.
5. Coolant and Lubrication
Coolants and lubricants are used during machining to dissipate heat and reduce friction. Proper coolant selection and application are essential for maintaining surface quality.
6. Machine Rigidity
The rigidity of the machining equipment can affect surface finish. Vibration and chatter can lead to irregularities on the surface.
7. Tool Path and Tool Engagement
The path followed by the cutting tool and the degree of tool engagement with the workpiece can impact surface roughness. Toolpath optimization is critical in achieving consistent results.
8. Workpiece Fixturing
How the workpiece is held and fixtured during machining can affect surface quality. Proper fixturing ensures stable and uniform machining.
Surface Roughness Standards and Tolerances
Surface roughness standards and tolerances are essential for ensuring consistency and quality in manufacturing processes. These standards specify the allowable deviations from the desired surface finish and provide guidelines for inspection and quality control. Two widely recognized standards are ISO 1302 and ASME B46.1:
ISO 1302:1999
ISO 1302 provides a comprehensive framework for the indication and measurement of surface texture. It defines symbols, grade numbers, and measurement procedures. The standard also includes guidelines for specifying surface roughness on engineering drawings and technical documents.
ASME B46.1-2009
ASME B46.1, titled “Surface Texture (Surface Roughness, Waviness, and Lay),” is the American standard for surface texture. It covers surface roughness, waviness, and lay, providing detailed information on measurement methods, terminology, and specification practices.
Both standards emphasize the importance of clear communication between design engineers, manufacturers, and quality control personnel to ensure that surface finish requirements are met consistently.
Surface Roughness Measurement Techniques
Accurate measurement of surface roughness is crucial for quality control and compliance with specifications. Several techniques and instruments are available for measuring surface roughness:
1. Contact Profilometers
Contact profilometers use a stylus or probe that physically contacts the surface to measure height deviations. These devices are highly accurate and suitable for a wide range of surfaces. Common types of contact profilometers include skidded and skidless profilometers.
2. Optical Profilometers
Optical profilometers use non-contact methods, typically based on interferometry or confocal microscopy, to measure surface roughness. They are well-suited for delicate or soft materials and can provide 3D surface topography information.
3. Atomic Force Microscopy (AFM)
Atomic Force Microscopy is a high-resolution technique that uses a sharp probe to scan the surface at the atomic or molecular scale. AFM can provide detailed information about surface roughness at the nanometer level.
4. Laser Scanning Confocal Microscopy
Laser scanning confocal microscopy combines laser technology with high-resolution imaging to measure surface roughness non-destructively. It is suitable for complex and transparent materials.
5. White Light Interferometry
White light interferometry measures surface roughness by analyzing the interference patterns generated by white light reflected from the surface. It provides accurate 3D measurements with high vertical resolution.
6. Surface Roughness Testers
Surface roughness testers are portable instruments that use a stylus or probe to measure surface roughness in the field or on the shop floor. They are convenient for quick inspections and quality control checks.
The choice of measurement technique depends on factors such as the material being measured, the required level of accuracy, the surface’s size and shape, and the available budget.
Conclusion
Surface roughness is a critical aspect of manufacturing and engineering that directly impacts product performance, quality, and aesthetics. The use of surface roughness symbols, grade numbers, indication, terminology, and calculation methods is essential for communicating and achieving the desired surface finish in a standardized manner.
Engineers and manufacturers must consider various factors, including machining processes, cutting tools, materials, and measurement techniques, to control and optimize surface roughness effectively. Furthermore, adherence to surface roughness standards and tolerances ensures consistency and quality in manufacturing.
In today’s competitive global marketplace, where precision and reliability are paramount, a thorough understanding of surface roughness and its associated concepts is indispensable. By mastering the language of surface roughness and the tools used to measure and control it, professionals can deliver products that meet or exceed customer expectations and industry standards.
As technology continues to advance, so do the methods and instruments for measuring and analyzing surface roughness. Engineers and manufacturers must stay up-to-date with the latest developments in surface metrology to remain competitive and deliver cutting-edge products that meet the highest quality standards. Whether in aerospace, automotive, medical devices, or countless other industries, surface roughness will continue to be a critical factor in achieving success and customer satisfaction.
With this comprehensive overview of surface roughness symbols, grade numbers, indication, terminology, and calculation methods, you are now equipped to navigate the world of surface finish with confidence and precision. Embrace the importance of surface quality in your projects, and you’ll undoubtedly contribute to the advancement of technology and the quality of manufactured products in the years to come.