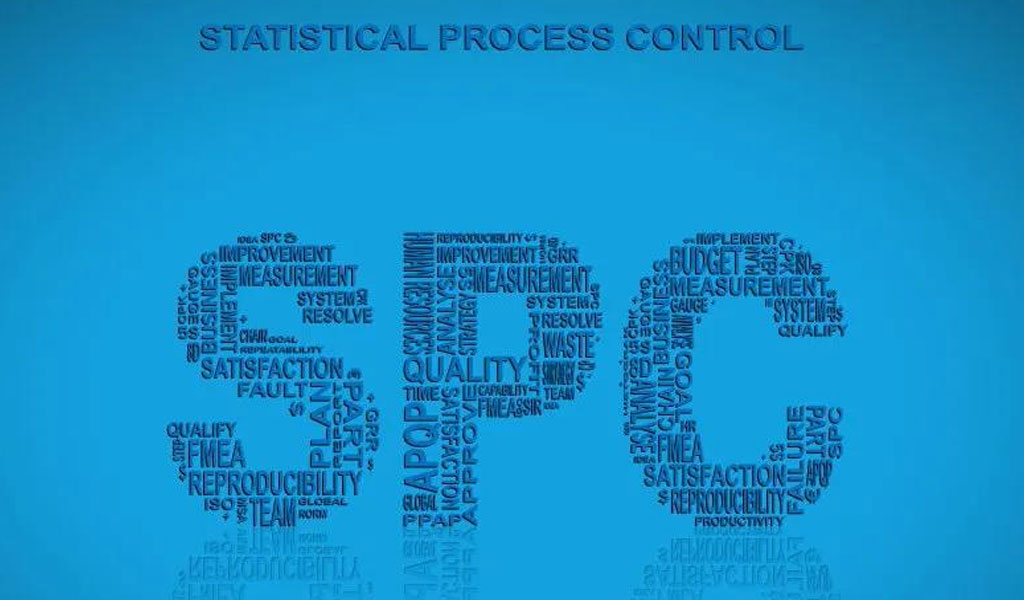
Statistical Process Control (SPC) is a method used in various industries to monitor, control, and improve processes. It involves the application of statistical methods to understand and manage the variation inherent in processes. By employing SPC techniques, businesses can ensure consistent quality, reduce defects, and enhance efficiency.

Understand Statistical Process Control (SPC)
Statistical Process Control (SPC) is a fundamental methodology used in various industries to monitor, control, and improve processes. It harnesses statistical techniques to ensure that manufacturing and production processes consistently meet quality standards.
SPC aids in understanding variability within a process and helps distinguish between common cause variation (inherent to the process) and special cause variation (resulting from external factors).
At its core, SPC involves collecting and analyzing data to understand the performance of a process. It employs control charts, histograms, Pareto charts, and other statistical tools to visualize and interpret data. These tools enable decision-makers to identify patterns, trends, and deviations from the expected performance, facilitating timely interventions when necessary.
The primary objective of SPC is to maintain processes within a state of control, minimizing variations that can lead to defects or subpar outcomes. By establishing control limits and evaluating the stability of a process, SPC helps organizations predict future performance and take proactive measures to prevent deviations that could affect quality.
Key Principles of Statistical Process Control
Statistical Process Control (SPC) is underpinned by several key principles that form the foundation of its application in managing and improving processes across various industries. These principles are integral to the successful implementation of SPC methodologies:
1. Understanding Variation:
SPC recognizes that all processes exhibit variation. This variation can be categorized into two types: common cause variation and special cause variation. Understanding the sources and nature of these variations is fundamental to effective process management. Common cause variation is inherent in a stable process and represents the typical fluctuations expected within a process. Special cause variation, on the other hand, arises due to identifiable factors that are not part of the typical process behavior. Recognizing and distinguishing between these variations is crucial for appropriate action.
2. Data Collection and Analysis:
Accurate and consistent data collection is the cornerstone of SPC. It involves collecting relevant data from the process being monitored and analyzing it using statistical tools and techniques. This step helps in understanding the nature and extent of variation present within the process.
3. Use of Control Charts:
Control charts are graphical tools that provide a visual representation of process variation over time. They display process measurements with upper and lower control limits. Observations falling within these limits indicate common cause variation, while those beyond suggest the presence of special causes that need investigation and intervention. Control charts are indispensable in identifying when a process is in or out of control.
4. Process Capability Analysis:
Assessing process capability is crucial to understand if a process is capable of meeting predefined specifications. Capability indices such as Cp, Cpk, Pp, and Ppk are used to evaluate whether a process operates within specified limits and tolerance ranges. This analysis aids in setting realistic goals for process improvement.
5. Continuous Improvement:
Continuous improvement is a core principle of SPC. It involves an ongoing effort to identify, analyze, and mitigate sources of variation to enhance process efficiency, reduce defects, and improve quality. This principle aligns with the PDCA (Plan-Do-Check-Act) cycle or similar methodologies to drive iterative improvements within the organization.
6. Responding to Out-of-Control Signals:
When control charts indicate the presence of special cause variation, it is imperative to investigate and address these issues promptly. Root cause analysis techniques are employed to identify the underlying reasons for deviations from the standard process. Corrective actions are then implemented to restore the process to a stable state.
7. Employee Involvement and Training:
Effective implementation of SPC requires the involvement and empowerment of employees. Training programs help personnel understand the principles and tools of SPC, enabling them to actively participate in data collection, analysis, and decision-making processes.
8. Management Commitment:
SPC success relies on strong management commitment and support. Management’s endorsement of SPC principles and willingness to allocate resources for training, implementation, and continuous improvement initiatives are critical factors for its successful deployment within an organization.
These key principles form the bedrock of Statistical Process Control, guiding organizations in their pursuit of quality improvement, waste reduction, and operational excellence. By embracing these principles, businesses can foster a culture of continuous improvement, enhance customer satisfaction, and achieve sustainable success in today’s competitive landscape.
How Does Statistical Process Control Work?
Central to SPC is the recognition that all processes exhibit variation. This variation can be categorized into two types: common cause variation and special cause variation. Common cause variation refers to the inherent, natural variation present in a stable process. On the other hand, special cause variation occurs due to external factors or anomalies that cause deviations from the standard process.Use statistical methods to monitor the status of the process and determine that the production process is under control to reduce product quality variation.

When the process is only affected by random factors, the process is in a statistically controlled state (referred to as a controlled state); when there are systematic factors in the process, the process is in a statistically out-of-control state (referred to as an out-of-control state). Due to the statistical regularity of process fluctuations, when the process is under control, the process characteristics generally obey a stable random distribution; when it is out of control, the process distribution will change. SPC uses the statistical regularity of process fluctuations to analyze and control the process. Therefore, it emphasizes that the process operates in a controlled and capable state, so that products and services can stably meet customer requirements.
The process of implementing SPC is generally divided into two major steps: first, use SPC tools to analyze the process, such as drawing control charts for analysis, etc.; take necessary measures based on the analysis results: it may be necessary to eliminate systemic factors in the process, or management may be required Intervention to reduce random fluctuations in the process to meet process capability requirements. The second step is to use control charts to monitor the process.
Control charts are the most important tool in SPC. Currently, traditional control charts based on Shewhart’s principle are widely used in practice, but control charts are not limited to this. In recent years, some advanced control tools have been gradually developed, such as EWMA and CUSUM control charts for monitoring small fluctuations, proportional control charts and target control charts for controlling small batches and multi-variety production processes; and control charts for controlling multiple quality characteristics.
Implementation of Statistical Process Control
The successful implementation of Statistical Process Control (SPC) involves a systematic approach encompassing various stages and strategies. Here’s an in-depth exploration of the steps involved in implementing SPC:
1. Define the Process:
Identification: Begin by clearly defining the process that needs monitoring and improvement. Understand its inputs, outputs, key variables, and critical-to-quality factors.
Scope Definition: Establish the boundaries of the process to be analyzed. Define the goals and objectives for implementing SPC within this process.
2. Select Appropriate Metrics:
Identification of Key Metrics: Identify and select the key performance indicators (KPIs) that will be monitored to evaluate process performance. These metrics should align with the process goals and objectives.
Data Collection Plan: Develop a plan for collecting relevant data at regular intervals. Determine how data will be collected—whether through automated systems, manual measurements, or sampling methods.
3. Data Collection and Analysis:
Data Collection: Implement the data collection plan and ensure the accuracy and consistency of data obtained from the process. This phase may involve training personnel responsible for data collection.
Statistical Analysis: Utilize statistical tools and techniques to analyze the collected data. This includes constructing control charts, histograms, scatter plots, and other graphical representations to understand variation and identify patterns.
4. Establish Control Limits:
Calculation of Control Limits: Calculate control limits for the selected metrics based on statistical methods. These limits distinguish between common cause variation and special cause variation.
Setting Control Rules: Establish rules for interpreting control charts, defining what actions to take when data points fall outside established control limits.
5. Implement Control Charts:
Creation of Control Charts: Develop and maintain control charts for the selected metrics. These charts provide a visual representation of the process’s performance over time.
Regular Monitoring: Continuously monitor the control charts to detect any deviations or trends that may indicate special cause variation. Ensure regular review by qualified personnel.
6. Responding to Out-of-Control Signals:
Root Cause Analysis: When an out-of-control signal occurs on a control chart, conduct a thorough investigation to identify the root cause of the variation. This may involve using tools like Fishbone diagrams, 5 Whys, or Pareto analysis.
Implement Corrective Actions: Develop and implement corrective actions to address identified root causes and bring the process back into a stable, controlled state.
7. Continuous Improvement:
Review and Refinement: Periodically review the effectiveness of implemented changes and refine processes based on lessons learned. Continuously seek opportunities for improvement.
Employee Involvement: Encourage and involve employees in the improvement process. Foster a culture of participation, where employees are engaged in identifying issues and suggesting improvements.
8. Documentation and Standardization:
Documentation of Procedures: Document all processes, procedures, and changes made as part of the SPC implementation. This ensures consistency and serves as a reference for future improvements.
Standardization: Standardize the SPC methods and procedures across relevant departments or areas within the organization to maintain uniformity and facilitate communication.
9. Management Support and Commitment:
Leadership Involvement: Ensure active support and commitment from top management. Leaders should champion SPC initiatives, allocate resources, and endorse the importance of quality improvement.
Training and Education: Provide adequate training and education to employees at all levels to enhance their understanding of SPC principles and techniques.
The implementation of Statistical Process Control involves a comprehensive and iterative process aimed at continuously improving processes and ensuring quality. By following these steps and integrating SPC methodologies into organizational culture, businesses can drive efficiency, reduce defects, and achieve sustainable improvements in their operations.
The History Of Statistical Process Control
In 1924, Dr. W.A. Shewhart drew the first SPC control chart and published “Economic Control of Quality of Manufactured Products” in 1931. SPC was used in various This is where manufacturing process improvements begin.
SPC is a scientific method used to analyze data and use the analysis results to solve practical problems. As long as the problem can be expressed numerically, SPC can be applied for analysis. Generally, the collected data will fluctuate. Plot these data on the graph. The sampling values fluctuate up and down within a certain range. Why do these fluctuations occur? The reasons may be raw materials, equipment, air pressure, operator physiology, and psychology. caused by differences. The basic principles of SPC are as follows:
- The measured product quality characteristics are the result of some accidental factors.
- Certain “unanimous phenomena under accidental factors” are inherent in any manufacturing and testing structure.
- There will be no reason for changes in this inherent “consistent phenomenon” state.
- The causes of changes outside this state can be discovered and corrected.
It can be seen that Dr. Shewhart divided the variation that affects product quality into two types of factors: non-attributable variation and attributable variation:
- Non-attributable variation factors can affect the product at any time during the process.
- Attributable variation factors only affect the product during the process under certain specific conditions.
If a process is only affected by factors that cannot be blamed for variation, the process is called a stable process, that is, the variation in product quality characteristics is within the predictable statistical control range; on the other hand, if a process is also affected by factors that cannot be blamed If two variability factors can be attributed, the process is unstable, and the variability of product quality characteristics cannot be predicted by statistical methods. SPC Charts are a statistical technique used to determine whether a process is stable, or to distinguish whether a process is affected by unattributable variation factors or attributable variation factors.
After nearly 70 years of practice around the world, SPC theory has developed very well, its integration with computer technology has become increasingly close, and its application scope and degree in enterprises has also been very wide and deep. In summary, the development of SPC presents the following characteristics:
- The analysis function is powerful and plays an obvious role in assisting decision-making. Based on the practice of many enterprises, a variety of statistical methods and analysis tools have been developed. These methods and tools can be used to conduct in-depth research and analysis of data according to different purposes and from different angles. , in this process, the auxiliary decision-making function of SPC is increasingly strengthened;
- Reflect the idea of total quality management. With the popularization of the idea of total quality management, the application of SPC in enterprise product quality management has gradually expanded from quality control of the manufacturing process to product design, auxiliary production processes, after-sales services and product use, etc. Quality control in each link emphasizes prevention and control of the entire process;
- Closely integrated with computer network technology, modern enterprise quality management requires more factors inside and outside the enterprise to be included in the scope of inspection and monitoring. The management functions of different departments within the enterprise simultaneously show two characteristics: increasingly detailed division of labor and closer cooperation. , which requires rapid processing of data from different sources and maximum resource sharing. To meet this need, SPC has become more and more closely integrated with computer technology, especially network technology.
Other Features Of Statistical Process Control
- Involve everyone, not just rely on a few quality managers;
- Emphasize the use of statistical methods to ensure the realization of the precautionary principle;
- SPC is not used to solve the problem of which control chart to use for individual processes. SPC emphasizes solving problems from the perspective of the entire process and the entire system.
- It can determine abnormalities in the entire process and report to the police in time.
- Engineering accuracy (Capability of Accuracy)
- The standard values of the controlled items must first be determined.
The purpose of setting the standard value of control items is to hope that the actual values of various products manufactured with this value can be distributed in a symmetrical normal manner around the center of the standard value, and the standard value should also be targeted during manufacturing. The purpose of engineering accuracy (Ca) evaluation is to measure the consistency of the average process with the standard. Sometimes the engineering accuracy index is also called the correctness index.
The Implementation Phase Of Statistical Process Control
The implementation of SPC is divided into two stages, one is the analysis stage, and the other is the monitoring stage. The control charts used in these two stages are called analysis control charts and control control charts respectively.
The main purpose of the analysis phase is to:
- Keep the process in a statistical steady state;
- Make the process capable enough.
The first thing to be done in the analysis stage is production preparation, that is, preparing the raw materials, labor, equipment, measurement systems, etc. required for the production process in accordance with standard requirements. Production preparation can be carried out after completion. Pay attention to ensure that production is carried out without abnormality in various factors that affect production; then the data collected during the production process can be used to calculate control limits and make control charts, histograms, etc. for analysis. Or perform process capability analysis to check whether the production process is in a statistical steady state and whether the process capability is sufficient. If any of them cannot be satisfied, the cause must be found, improvements made, and production and analysis prepared again. Until the two purposes of the analysis phase are achieved, the analysis phase can be declared over and enter the SPC monitoring phase.
The main work of the monitoring phase is to use control charts for monitoring. At this time, the control limits of the control chart have been determined based on the results of the analysis phase. The data of the production process are plotted on the control in time, and the control chart is closely observed. The fluctuation of the points in the control chart can show that the process is under control or out of control. If it is found Out of control, the cause must be found and its effects eliminated as soon as possible. Monitoring can fully reflect the role of SPC preventive control.
In practical applications in factories, each control project must go through the above two stages, and the process from analysis to monitoring will be repeated when necessary.
In Conclusion
Implementing Statistical Process Control (SPC) is a strategic endeavor that holds immense potential for organizations aiming to enhance quality, efficiency, and competitiveness. Through the systematic application of statistical methods and principles, SPC empowers businesses to manage and improve their processes effectively.
Achieving Continuous Improvement:
SPC’s essence lies in its ability to foster a culture of continuous improvement. By systematically collecting and analyzing data, organizations gain insights into process variations, enabling them to distinguish between common and special causes of variation. This distinction empowers proactive decision-making, allowing for targeted interventions to address underlying issues and prevent defects.
Sustained Quality and Efficiency:
Through the establishment of control charts, setting control limits, and rigorous monitoring, SPC ensures that processes remain within acceptable boundaries. When deviations occur, SPC prompts investigations into root causes, enabling corrective actions that restore processes to their optimal state. This commitment to maintaining control over processes results in sustained quality, reduced waste, and enhanced operational efficiency.
Empowering Employees and Driving Engagement:
Successful SPC implementation necessitates the involvement and empowerment of employees at all levels. Through training and education, employees become proficient in utilizing SPC tools and interpreting data, thereby actively contributing to the improvement process. This engagement fosters a sense of ownership, instilling a culture where continuous improvement becomes a shared organizational goal.
Organizational Commitment and Leadership:
The commitment and support of organizational leadership play a pivotal role in SPC’s success. Leaders must champion the adoption of SPC methodologies, allocate resources, and create an environment conducive to innovation and improvement. When management embraces SPC principles, it encourages a mindset shift towards data-driven decision-making and fosters an atmosphere where quality is a collective responsibility.
Statistical Process Control represents more than just a set of statistical tools; it embodies a philosophy of continuous improvement deeply ingrained in an organization’s culture. By adhering to SPC principles—understanding variation, data-driven analysis, establishing control, and fostering a commitment to improvement—businesses can drive sustainable growth, minimize errors, enhance customer satisfaction, and remain competitive in dynamic market landscapes. SPC’s systematic approach to process management not only elevates product and service quality but also serves as a catalyst for organizational excellence in an ever-evolving business environment.
Newest Rapid Parts & Component Case Studies
Learn how we are advancing industries like medical, defense, and aerospace by fabricating some of the smallest, most complex and intricate metal components available.
Newest Rapid News,Encyclopedia Blog and Latest FAQs Articles
Find all BE-CU Prototype news and blog posts here. Check out the latest industry trends and take inspiration from our updated blogs, giving you a fresh insight to help boost your business.


